Mostly Markets
Stocks/Information Technology/Semiconductor Materials & Equipment

Applied MaterialsAMAT

Semiconductor Materials & Equipment · Santa Clara, California · In the S&P 500
Solid business
$390.09−7.49%After hours: $392.83 (+0.70%)At the close, 30 Oct · Prices from CNBC, may be delayed
▲ 65.5% over 1 year
Applied Materials over 1 yearDaily close, $, to 30 Oct 2026
$200$600Nov2026MarMayJulSep$390.09$200$600NovMarJul$390.09
Source: Nasdaq daily closes
Market value$310B
Price to earnings33.6x
Forward P/E21.9x
Dividend yield0.54%
Year to date+51.8%
One year+65.5%
Next earningsThu 12 Nov, after the close
52-week range (closes)
$220.23$723.00

Quality and valuation

How Applied Materials compares with other information technology stocks. A description, not a recommendation.

Applied Materials and 4 semiconductor materials & equipment peers. Across: valuation (P/E) against the sector. Up: business quality against the sector. Hover or tap a logo for its numbers.

Business quality: about averageValuation: in line with its sector

An average business among information technology companies, priced about in line with them.

Applied Materials trades at 21.9 times the next 12 months of expected earnings, against a median of 22.2x for the 99 information technology stocks we cover. The quality score blends where it ranks on revenue growth, gross margin, operating margin and free-cash-flow margin (net margin for banks and insurers) over the last 12 months, from SEC filings.

  • Revenue grew slower than the sector median: +7.8% vs +20.6%
  • Keeps less of each sale (gross margin): 49.4% vs 61.5%
  • More profitable (operating margin): 29.6% vs 17.0%
  • Turns less of its sales into cash: 18.2% vs 21.7%
AMAT trades at 21.9x forward earnings, below the sector medianForward p/e, Semiconductor Materials & Equipment peers
AMAT21.9xQ24.1xLRCX24.9xKLAC27.5xTER28.8xSector median 22.2xAMAT21.9xQ24.1xLRCX24.9xKLAC27.5xTER28.8xSector median 22.2x
Source: CNBC quotes; Mostly Markets
At 33.7x earnings, AMAT is pricier than its average since Aug 2024Price over the last 12 months of reported (GAAP) diluted EPS
P/EUsual range (±1 s.d.)
20x40x60xAverage 29.8x2025202633.7x20x40x60xAverage 29.8x2025202633.7x
Source: Nasdaq prices; SEC filings

Financials

From Applied Materials's SEC filings, through the quarter ending 26 Jul 2026. Hover or tap a bar for its value.

Revenue grew 24.8% from a year earlierQuarterly revenue, $bn, latest Q3 ’26
$0bn$2bn$5bn$8bnQ4 ’24Q2 ’25Q4 ’25$9.1bnQ3 ’26$0bn$5bnQ4 ’24Q2 ’25Q4 ’25$9.1bnQ3 ’26
Source: SEC filings
Growth sped up to +24.8% last quarterRevenue growth, year on year, %
0%10%20%Q4 ’24Q2 ’25Q4 ’2524.8%Q3 ’260%10%20%Q4 ’24Q2 ’25Q4 ’2524.8%Q3 ’26
Source: SEC filings
Operating margin was 33.7% last quarterOperating income as a share of revenue, %
0%10%20%30%Q4 ’24Q2 ’25Q4 ’2533.7%Q3 ’260%20%Q4 ’24Q2 ’25Q4 ’2533.7%Q3 ’26
Source: SEC filings
Free cash flow was $5.6 billion over 12 monthsQuarterly free cash flow (operating cash flow minus capex), $bn
$0bn$1bn$2bnQ4 ’24Q2 ’25Q4 ’25$2.3bnQ3 ’26$0bn$1bn$2bnQ4 ’24Q2 ’25Q4 ’25$2.3bnQ3 ’26
Source: SEC filings
Last 12 monthsAMATSector median
Revenue growth+7.8%+20.6%
Gross margin49.4%61.5%
Operating margin29.6%17.0%
Free cash flow margin18.2%21.7%
Price to earnings33.6x33.1x

Stories on Applied Materials

Thursday, 22 October
Why it moved

Lam Research (LRCX), KLA (KLAC) and Applied Materials (AMAT) Shares Slide: What Happened

Lam Research plunged 11.8% on Thursday after warning that short supplies of factory space and parts will limit chipmakers into 2027. KLA lost 9.5% and Applied Materials 8.2%.

LRCX▼ 11.8%
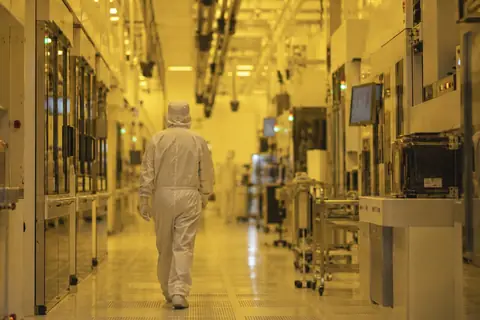
Inside a chip factory's cleanroom

Similar companies

Semiconductor Materials & Equipment, by market value.

CompanyPriceTodayYTDValue
LRCXLam Research$239.11−6.01%+39.7%$299B
KLACKLA$157.91−5.69%+30.0%$206B
TERTeradyne$274.37−7.38%+41.7%$42.90B
QQnity Electronics$116.67−4.88%+42.9%$24.41B